HeatMapIQ
Turn website heatmaps into a ranked list of fixes.
A web app that reads the behaviour data you already collect and hands your team a clear, prioritised plan to improve any page. It tracks your progress and shares in one click.

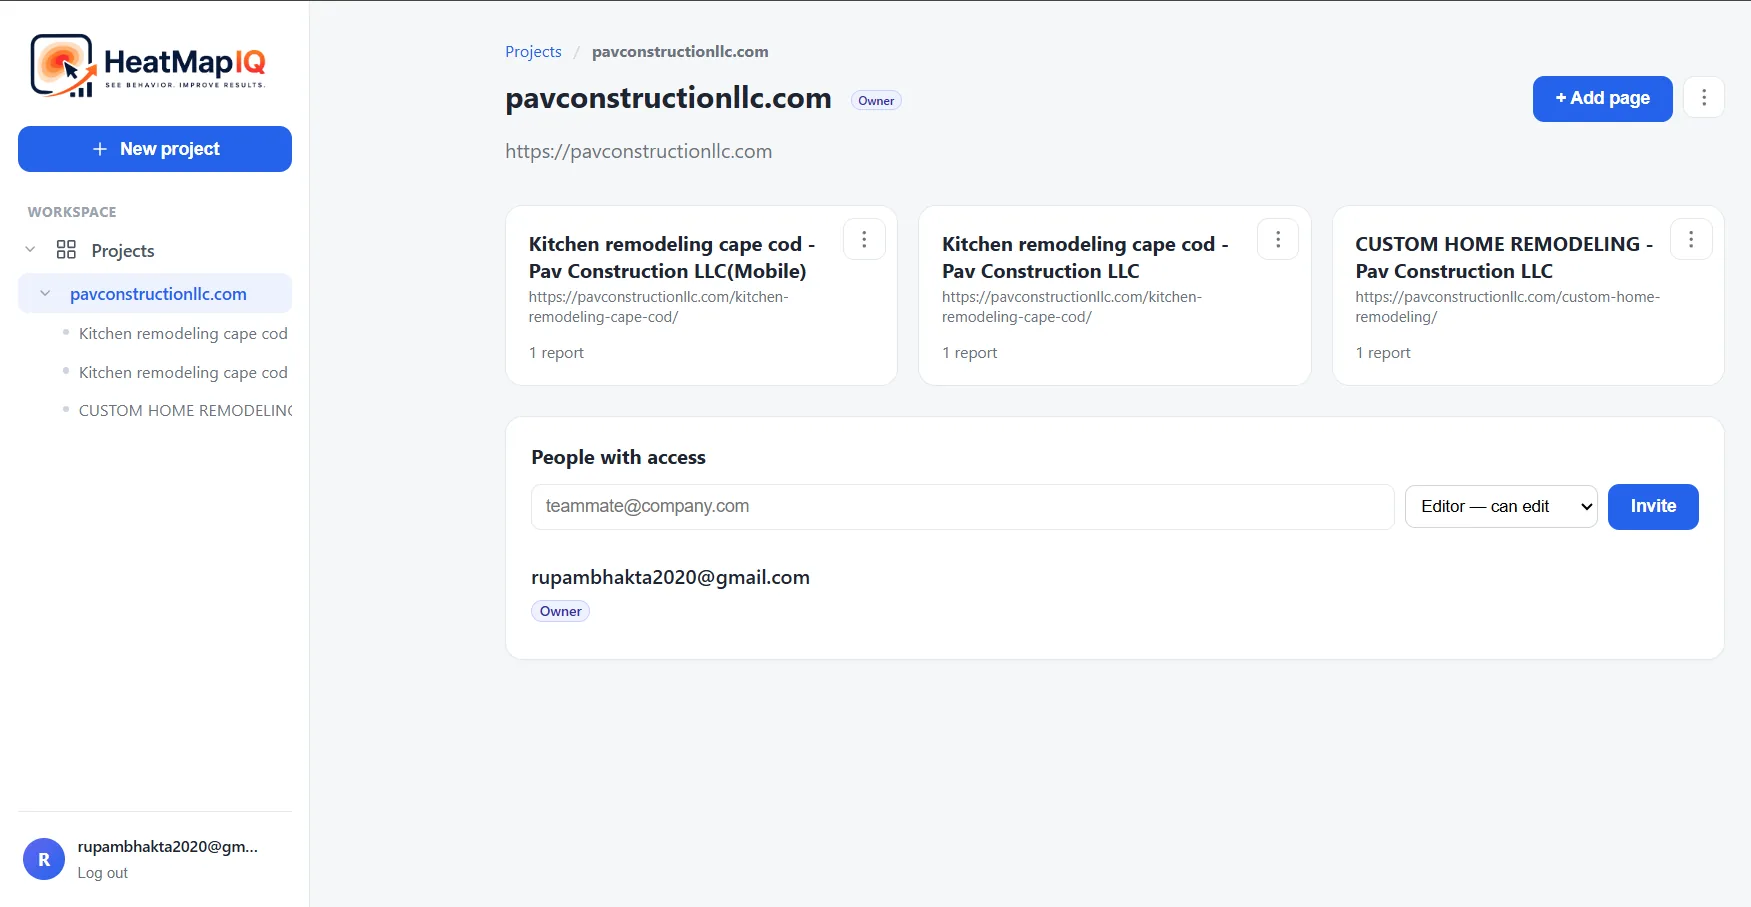
What is HeatMapIQ?
Modern analytics tools can record how visitors behave on a website: where they click, how far they scroll, and which parts of a page hold their attention. That behaviour gets captured as “heatmaps.” The problem is that the raw exports are dense, cryptic tables that most teams never open, let alone act on.
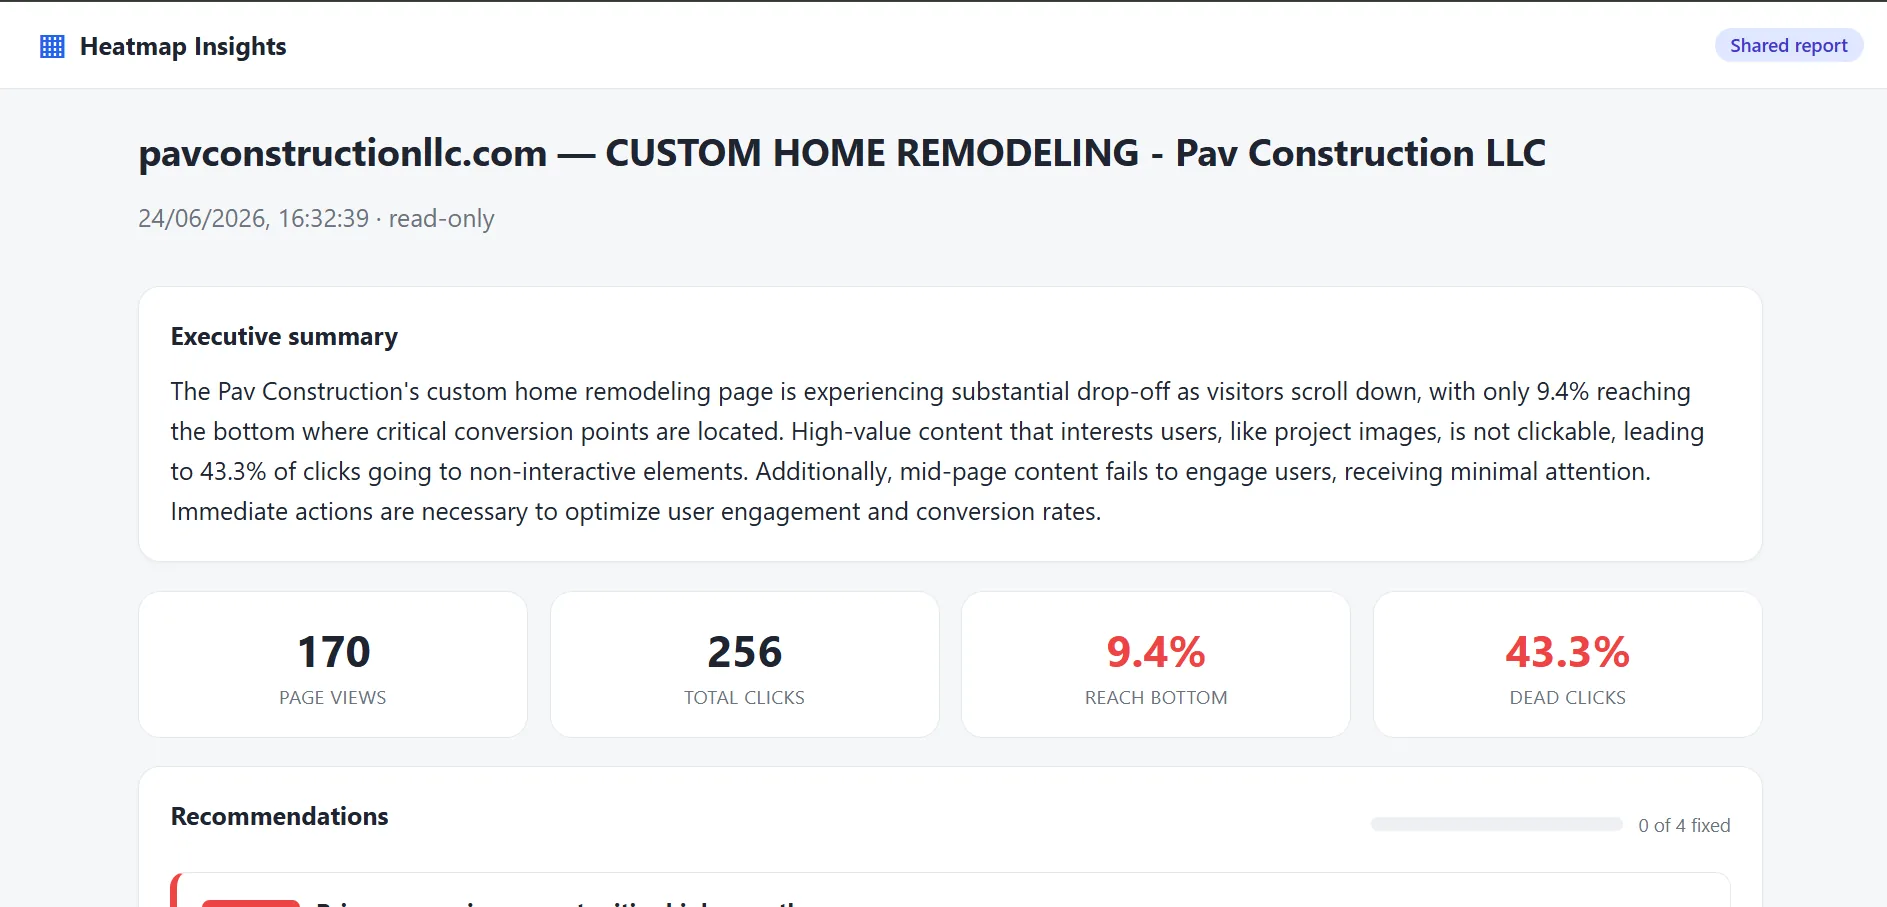
HeatMapIQ closes that gap. It takes the heatmap exports a team already collects and turns them into a plain-English report: a ranked list of what is going wrong on each page, the evidence behind every issue, the recommended fix, and the impact you can expect. Teams tick off each fix as it ships, watch a progress bar fill up, and share a read-only version of the report through a single link.
It turns a pile of data nobody reads into a short to-do list everybody can follow.
The problem it solves
Website and marketing teams collect behaviour data, but turning it into action is slow and needs specialist skill. Three pain points come up again and again.
The raw data is unreadable
Heatmap exports describe page elements in a technical shorthand, so it is hard to tell which real button, image, or link a number actually refers to.
It is hard to know what matters most
A page can have dozens of small signals. Without a way to rank them, teams either fix low-impact things or freeze because everything looks equally urgent.
Findings get lost
Insights live in one person’s spreadsheet. There is no shared place to track which fixes were done, by whom, or to show a client the results.
The result is guesswork: teams redesign pages on instinct, disagree about priorities, and rarely close the loop on whether a change actually helped.
Three signals, read in plain English.
HeatMapIQ was built to make behaviour data usable by anyone on the team, not just the analysts. It reads the three standard heatmap types and puts them into everyday language.
Clicks
Including “dead clicks,” where people tap something that isn’t actually clickable. That’s a clear sign the design is misleading them.
Scroll depth
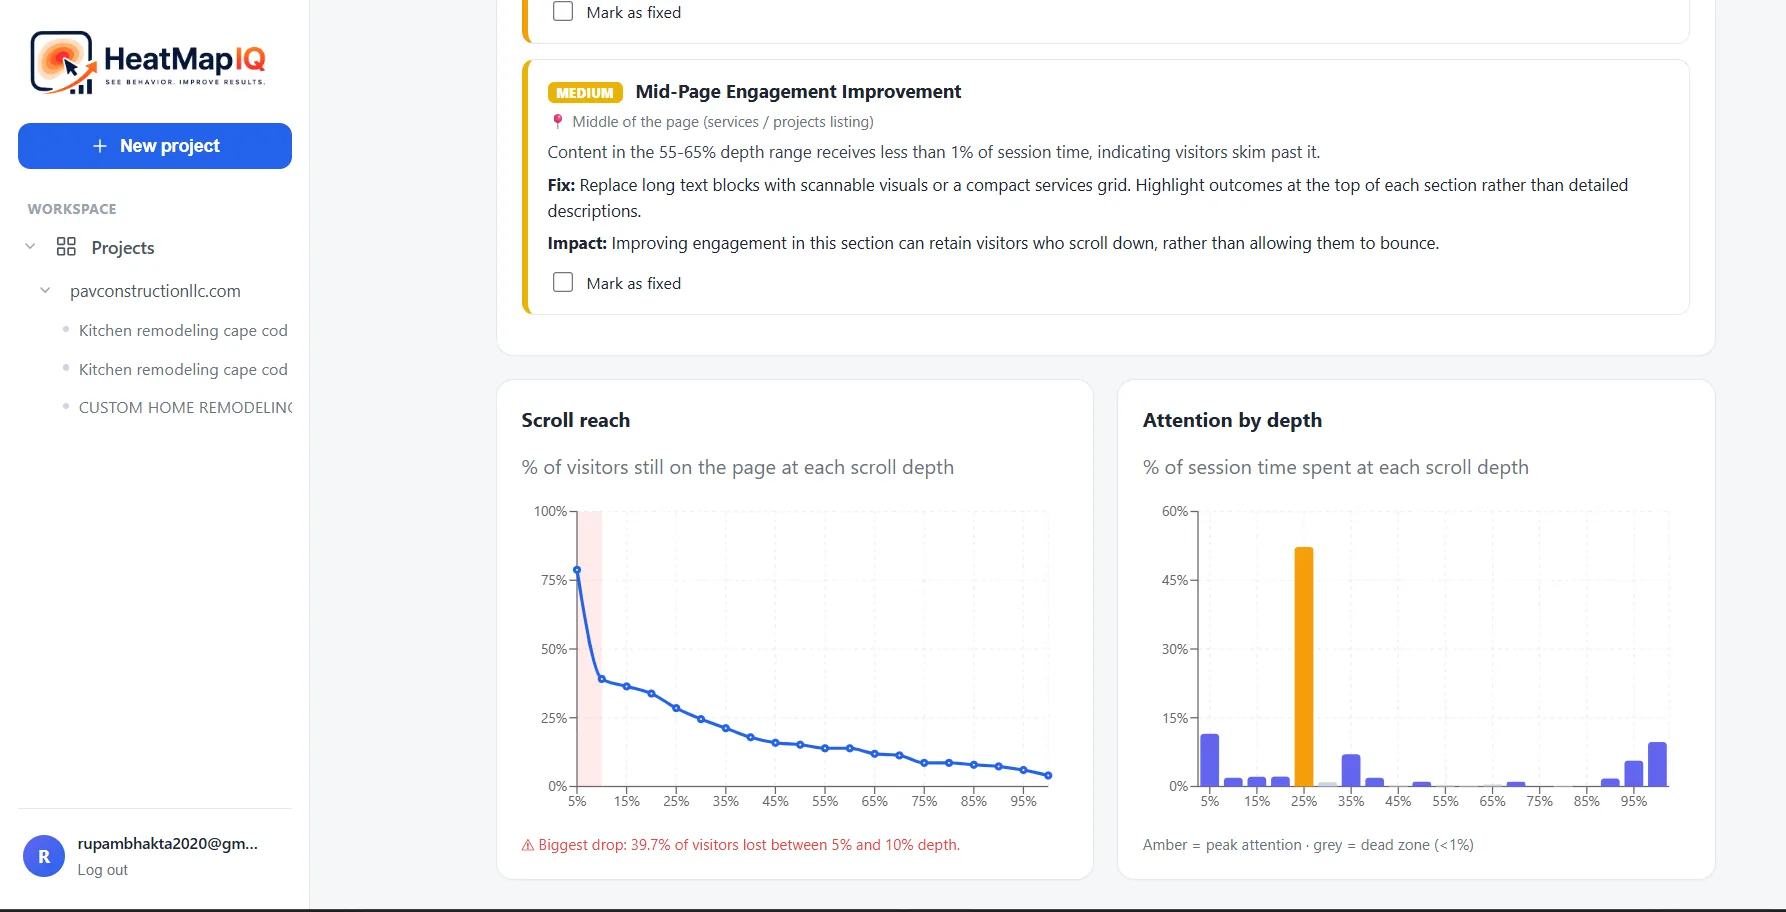
How far down the page visitors actually get, so important content and calls-to-action can be moved into view.
Attention
Which sections hold people’s focus and which are quietly ignored.
Every finding is tagged with a severity level, so the highest-impact fixes rise to the top. Teams work the list from the top down, mark each item as fixed, and share the live report, running progress and all, whenever they need to.
From raw data to action in three steps.
- 1
Upload the exports
Drop in the click, scroll, and attention files for a page. Optionally add the page’s web address so every finding is tied to the real element on the page.
- 2
Get an instant analysis
HeatMapIQ reviews the data and produces a ranked report of dead clicks, drop-off points, and attention gaps, each with the evidence behind it and a recommended fix, in plain English.
- 3
Act, track & share
Work through the issues by priority, tick off each fix as it ships, and share a read-only link with teammates or clients. The shared view always shows the latest progress.
What’s inside
Everything a team needs to act on behaviour data, organised so nothing gets lost.
Plain-English recommendations
Each issue explains what the data shows, where it is on the page, the recommended fix, and the impact you can expect.
Severity-ranked issues
Every finding is tagged critical, high, medium, or low, so the most valuable fixes are always at the top of the list.
Dead-click detection
Automatically flags clicks that land on things that aren’t clickable, a fast way to spot confusing design.
Scroll & attention insights
Visual charts reveal exactly where visitors stop scrolling and where their attention concentrates on the page.
Fix tracking
Tick each recommendation as done and watch an “X of Y fixed” progress bar, with a record of who completed what.
One-click sharing
Generate a read-only public link to any report, live progress included, and switch it off again whenever you like.
Team workspace
Group pages under projects and invite teammates as owners, editors, or viewers, keeping every report where it belongs.
Passwordless sign-in
Members log in with a one-time code sent to their email. No passwords to create, forget, or reset.
Shared reports carry the live progress bar, so a client always sees what has been shipped.
Benefits & outcomes
HeatMapIQ turns a specialist, time-consuming task into something any team member can do in minutes, and it changes how decisions get made.
Stop guessing
Decisions are grounded in what visitors actually do, not opinions, so teams stop debating and start shipping the right changes.
Focus on what pays off
Severity ranking puts the highest-impact fixes first, so limited time goes to the changes most likely to lift results.
Recover lost visitors
Surfacing drop-off points and dead clicks helps move key content into view and remove the friction that quietly costs conversions.
Move faster
What used to need a specialist and hours of spreadsheet work becomes a report anyone can produce and act on in minutes.
Keep everyone aligned
A shared, always-current report means the whole team, and clients too, see the same priorities and the same progress.
Show the results
A read-only link with a live progress bar makes it easy to show the work done and the improvements delivered.
Who it’s for
Made for the people responsible for how a website performs, whether or not they have a data background.
- Product & UX teams
- Who want evidence for design decisions and a clear list of what to improve next.
- Marketing & growth teams
- Focused on lifting conversions and getting more from the traffic they already have.
- Agencies & freelancers
- Who need a professional, shareable report to show clients the problems found and the fixes delivered.
- Small business owners
- Who collect behaviour data but don’t have an analyst to make sense of it.
Technology stack
A full-stack web application, built to run in a browser so the whole team can use it from anywhere, and so it’s easy to extend over time.
AI is optional by design. HeatMapIQ produces a full report on its own, and it can layer AI on top for richer wording when a key is provided, so it never depends on a single external service.
HeatMapIQ: see behaviour, improve results.
Sitting on data nobody reads?
Start a projectNext project